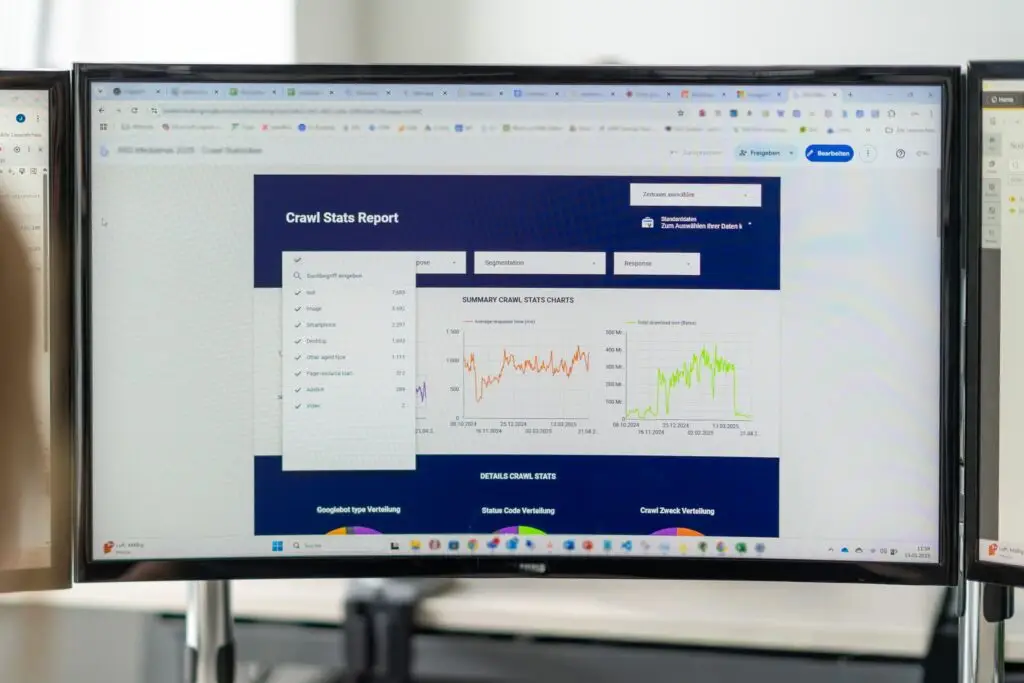

Introduction to the Logfile Light Method by SEOSOON
Crawl management is not a topic that only affects large websites. Even websites with URLs in the triple-digit range can be affected by “poor” crawl management, which often leads to long indexing times and unnecessary server requests.
Until now, log file analyses were the go-to method for finding out whether a site has poor crawl management and whether crawl budget is being wasted. However, this is very time-consuming and it is often not easy to access the log files. Additionally, log files usually only store data from the last 7 days, which limits their analytical value.
With the Logfile Analysis Light, we provide you with a process to determine crawl statistics from GSC data yourself. There are three approaches. For all of them, you need access to Google Search Console (at property level) and Google Looker Studio.
Is your website accessible to AI bots? Test it!
Which of your content does AI love? Click here for the tool!
Logfile Analysis Light (with GSC Helper)
The currently most convenient way to implement the Logfile Light method is by using the Chrome plugin „GSC Helper“ by Stephan Czysch, Google Sheets, and our Looker Studio Dashboard.
Video Tutorial
In the following video, I show you how to perform the Logfile Light analysis in just a few clicks. A step-by-step guide can be found below the video.
Step 1: Download the Crawl Statistics with the GSC Helper Plugin
Download the plugin and install it.
Open Google Search Console (GSC) and select the property you want to analyze.
In GSC, click on “Settings” and under Crawl Statistics click “Open report”. Then, under “Host”, select the analysis level (domain + all subdomains or just a single domain/subdomain).
Note: If you do not have access to the Domain property in GSC, the “Hosts” section will not be displayed and you do not need to make a selection here.
Above the crawl statistics, you should see the „Open advanced report“ button. Click on it and a new tab will open.
Note: The default settings can be kept; only in the „Host“ section should you select the domain you want to analyze.
Then click on „generate report“. After the report has been created, copy the data using the „Copy data to Clipboard“ button and paste it into an empty Google Sheet, then name the file.
Step 2: Connect the Looker Studio Dashboard
Open the Logfile Light Looker Studio Dashboard for GSC Helper, click on the three dots in the top right corner, and select “Make a copy”. You may also need to authorize the connection to Looker Studio.
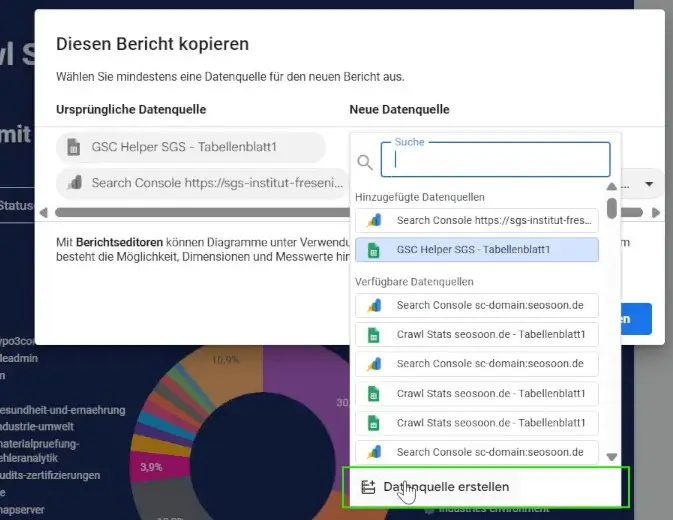
You will now be asked to link the dashboard to a data source.
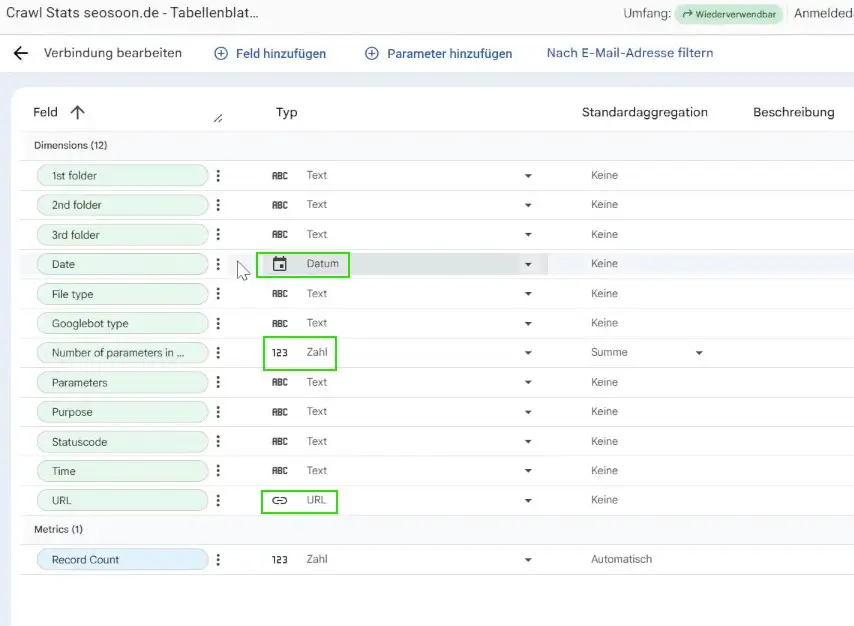
For the first data source at the top, select the Google Sheet you just created. Click on “Create data source” → “Google Sheets” → “Your Google Sheet” → “Sheet 1” tab and click “Connect” in the top right. You do not need to change anything in the dimension mapping.
Check that Date = Date, No. of parameters = Number, and URL = URL. The remaining data points should be formatted as „Text“.
For the 2nd data source, select Google Search Console as the connector, the property to be analyzed, and the settings “URL Impressions” → “Web”.
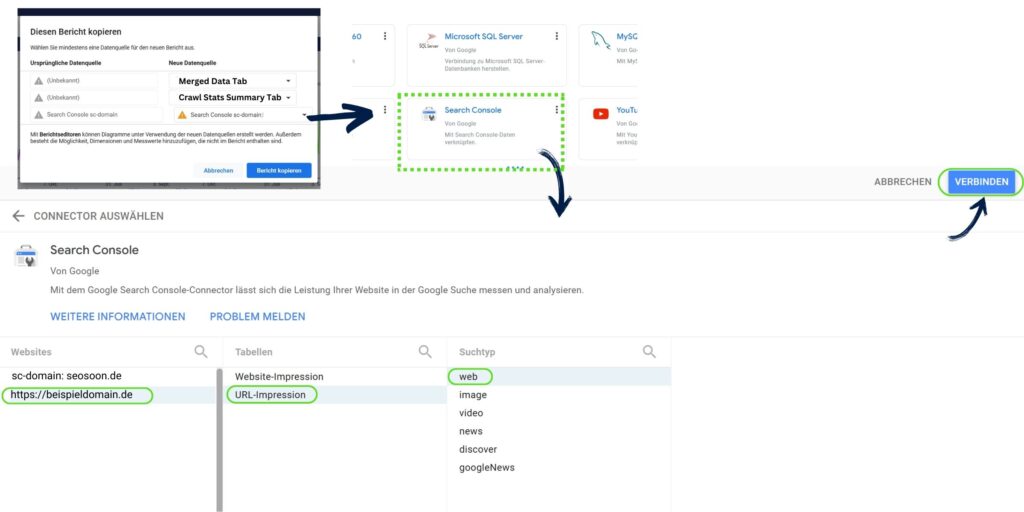
Click “Connect” in the top right and you’re done. 🎉
New Tools & Updates
We are constantly working on new tools and workflows to make our work even more efficient. We are happy to share these with you!
Check if AI bots can crawl your site: ►AI Bot Checker
Which bots love your content: ► Log File Analysis for AI.
Get notified when we have updates, new tools, and workflows!